In this post we will cover how you can quickly run a JMeter test from recording to results in a few minutes.
We will use OctoPerf to process our recording, launch the test and aggregate the results for us.
Recording and design
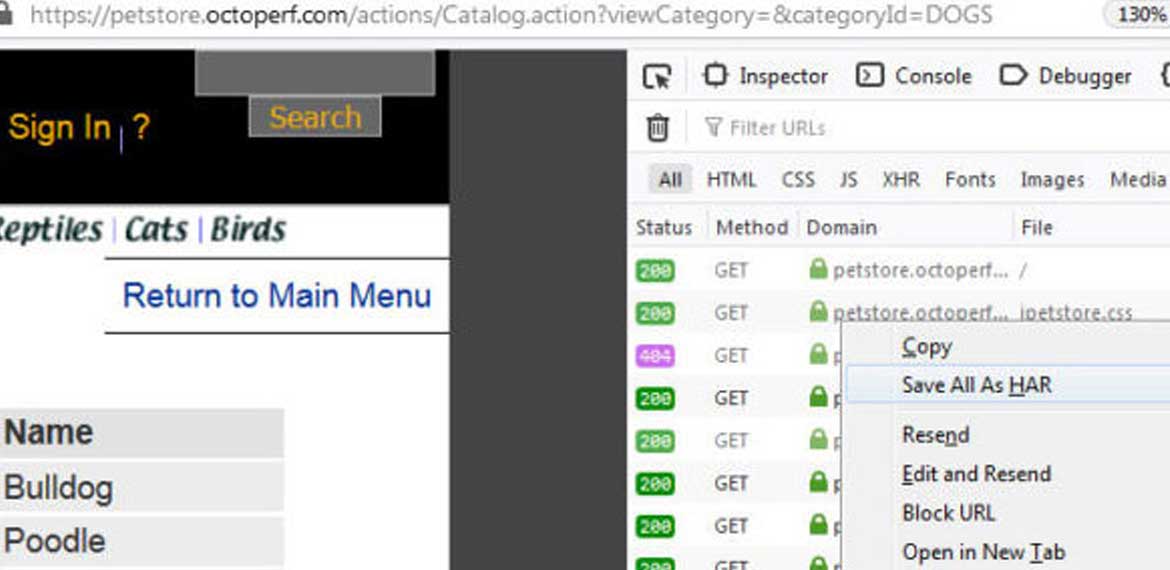
First we are going to use our browser to record traffic from a real application.
We do not need to install anything since that can be done by using the dev tools, more specifically the “Network” tab:
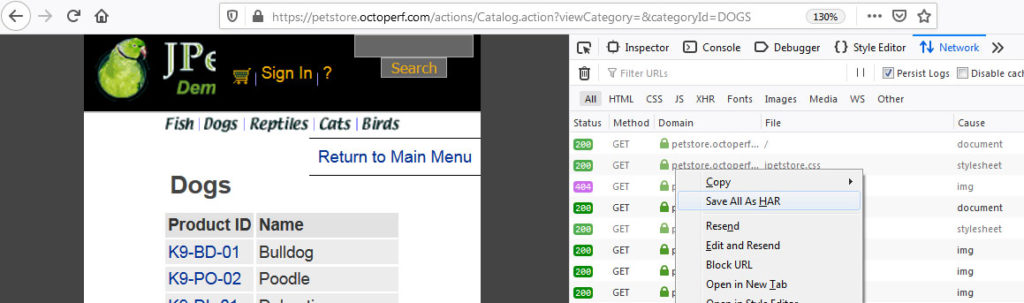
Then, when you’re done navigating through your application, you can export this traffic as a HTTP archive file and import it in OctoPerf.
We can then rework it in OctoPerf design engine, in particular to handle session IDs or other similar parameters.
This process can be time consuming, but OctoPerf will also help speed it up. You can see how that would work in our tutorials
If you are a JMeter user, note that any script/plugin or custom development you are using in JMeter can also be used with OctoPerf.
Execute the test
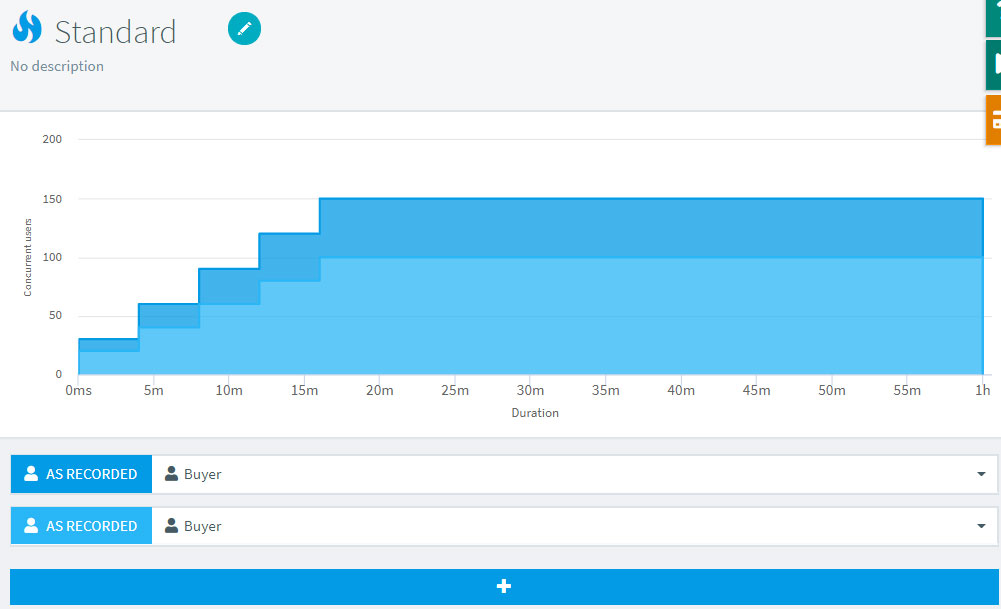
Now what remains is to execute the test; we can set up the load to be executed from different cloud locations so that we can compare the impact of latency:
Load generators will be started automatically as required, we do not have to trouble ourselves with the machines and their setup.
That can be incredibly convenient since JMeter requires a lot of tuning to work in an optimal fashion.
Analyse the results
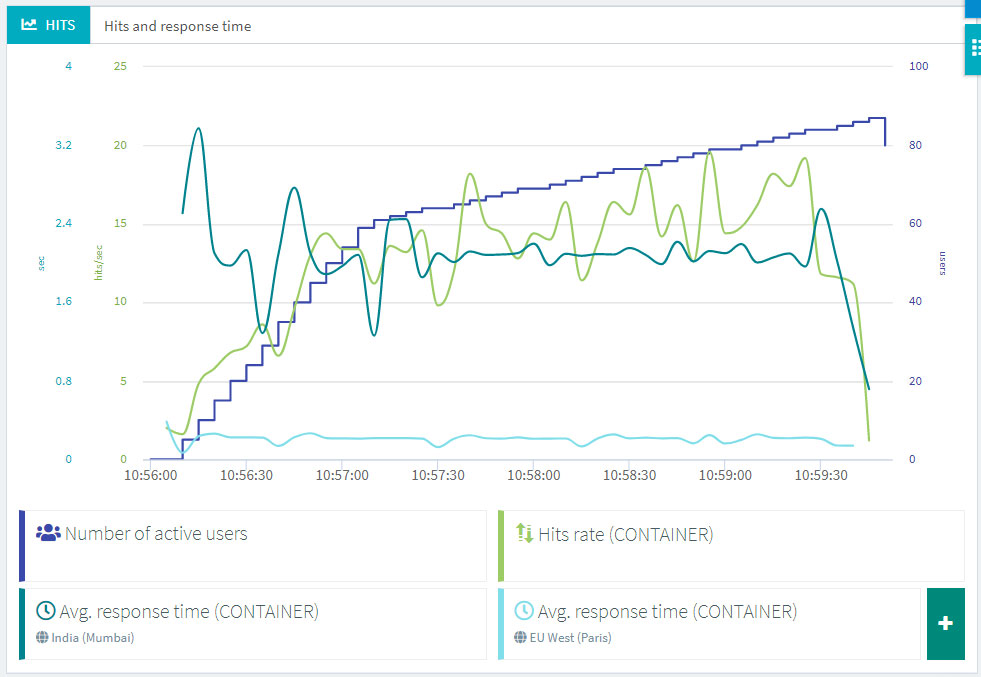
Once we launch the test, we will have access to the live report, with every metric being collected in real time it is possible to analyse our test as it goes:
That way we can quickly find out what is going on. Even more so thanks to our report templating that allows you to have the exact metrics you care about in every test report.
That is another pain point out of the way, since aggregating results from different load generators can be complex and has to be done after the test or through the use of a custom influxDB.
Conclusion
This post was aimed at giving you a quick overview of the productivity gains you can have when you operate JMeter through OctoPerf.